The Power of Healthcare Analytics
In today’s data-rich healthcare environment, intuition is not enough. Successful hospital administrators use data to:
- Identify operational bottlenecks
- Optimize resource allocation
- Track financial performance
- Improve patient outcomes
- Plan for growth
NileByteCare provides a comprehensive analytics suite that puts actionable data at your fingertips.
Executive Dashboard
The executive dashboard provides a high-level view of organizational performance:
Clinical Overview
| KPI | Description |
|---|---|
| Total Encounters (Month) | Volume of patient visits |
| Encounter Growth Rate | % change vs previous period |
| Active Patients | Unique patients seen |
| Department Performance | Encounters + revenue by department |
Financial Overview
| KPI | Description |
|---|---|
| Total Revenue (Month) | Revenue from all sources |
| Total Expenses | Operating expenses |
| Revenue Growth Rate | % change vs previous period |
| Net Profit | Revenue minus expenses |
| Monthly Trends | Revenue/expense trend chart |
Workforce Overview
| KPI | Description |
|---|---|
| Attendance Rate | % staff attendance |
| Staff on Leave | Current leave count |
| Active Practitioners | Clinicians on duty |
| Practitioner Load | Active encounters + scheduled appointments |
Operational Efficiency
| KPI | Description |
|---|---|
| Avg Consultation Time | Minutes per consultation |
| Bed Occupancy Rate | % inpatient beds filled |
| Avg Wait Time | Minutes patient waits before consultation |
Department Dashboards
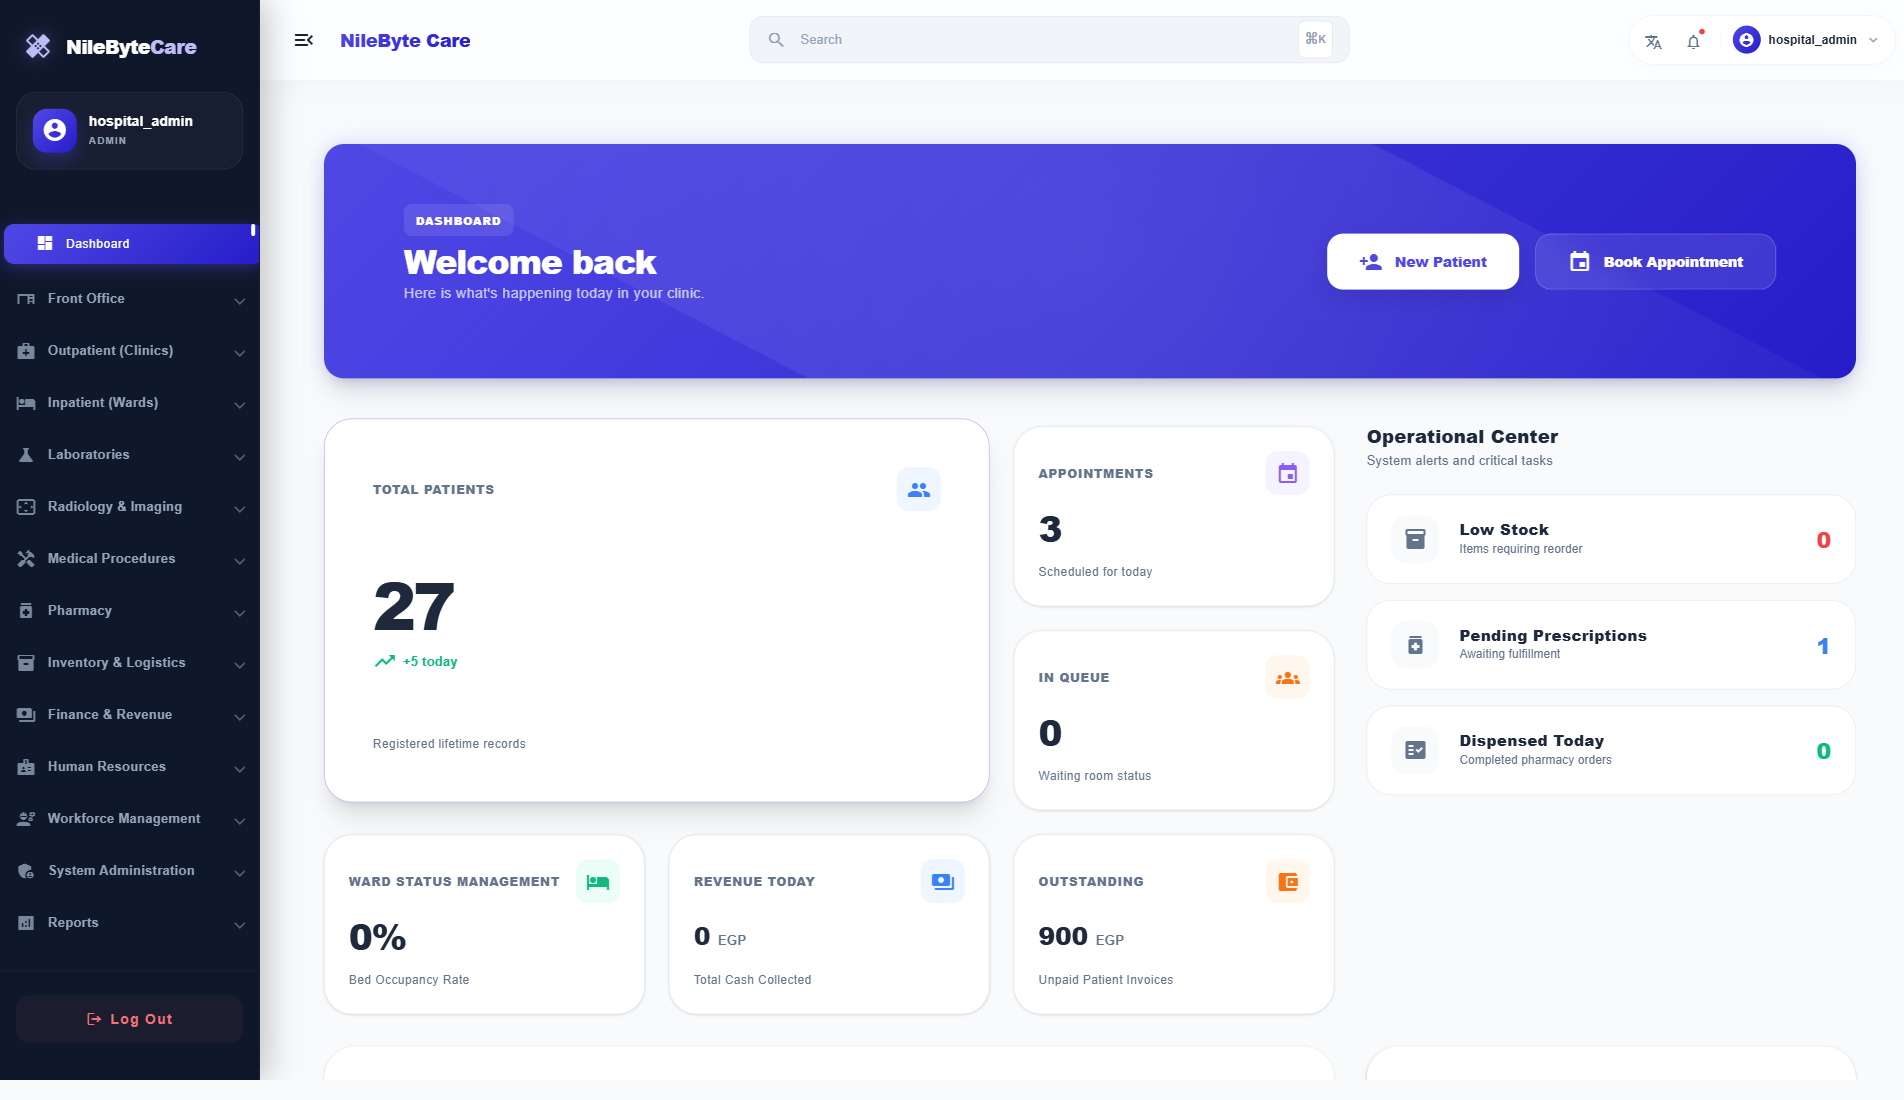
Dashboard Stats
Real-time operational metrics:
- Total patients registered
- New patients today
- Today’s appointments
- Active queue count
- Patients seen today
- Doctors on duty
- Revenue today
- Outstanding amount
- Bed occupancy rate
- Low stock alerts
- Pending pharmacy orders
Custom Reports
| Report Category | Available Reports |
|---|---|
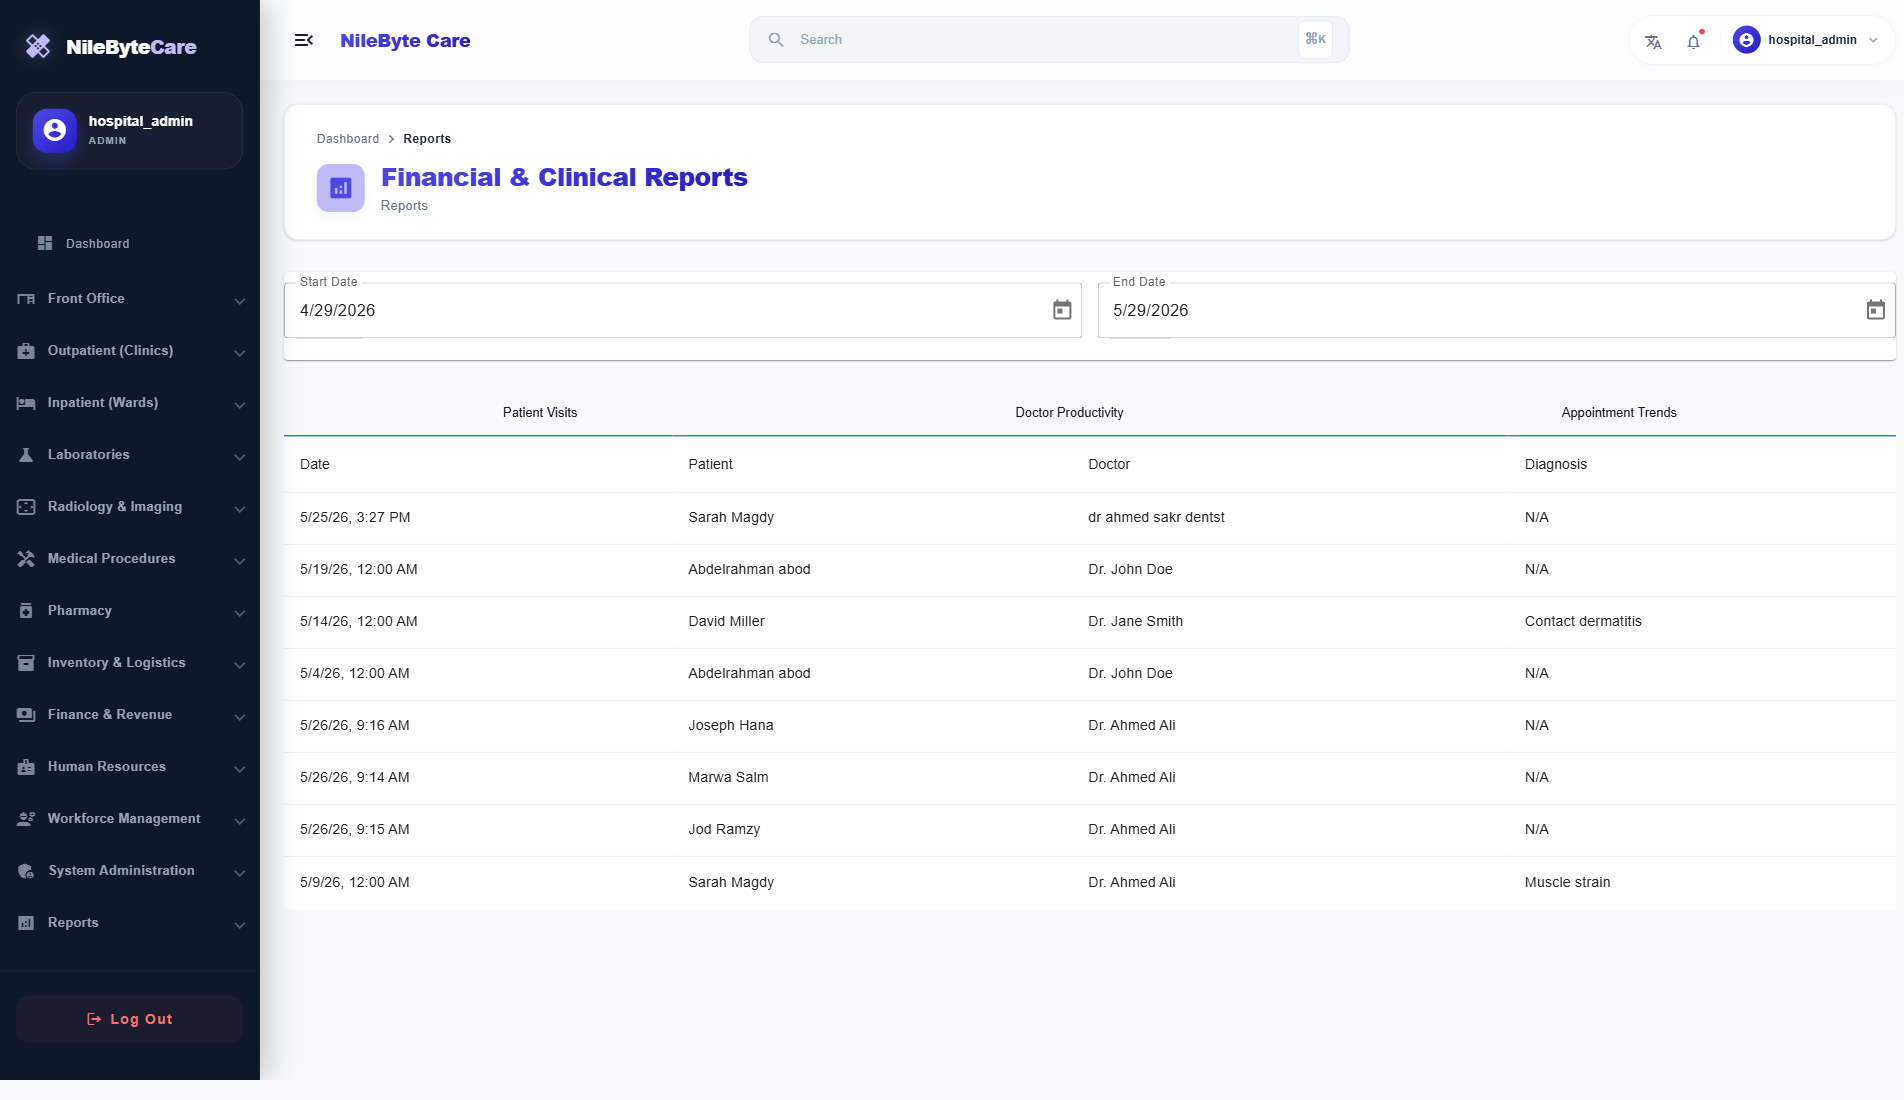
| Clinical | Patient visits, encounter volumes, diagnosis frequency |
| Doctor Productivity | Encounters per doctor, appointment completion rates |
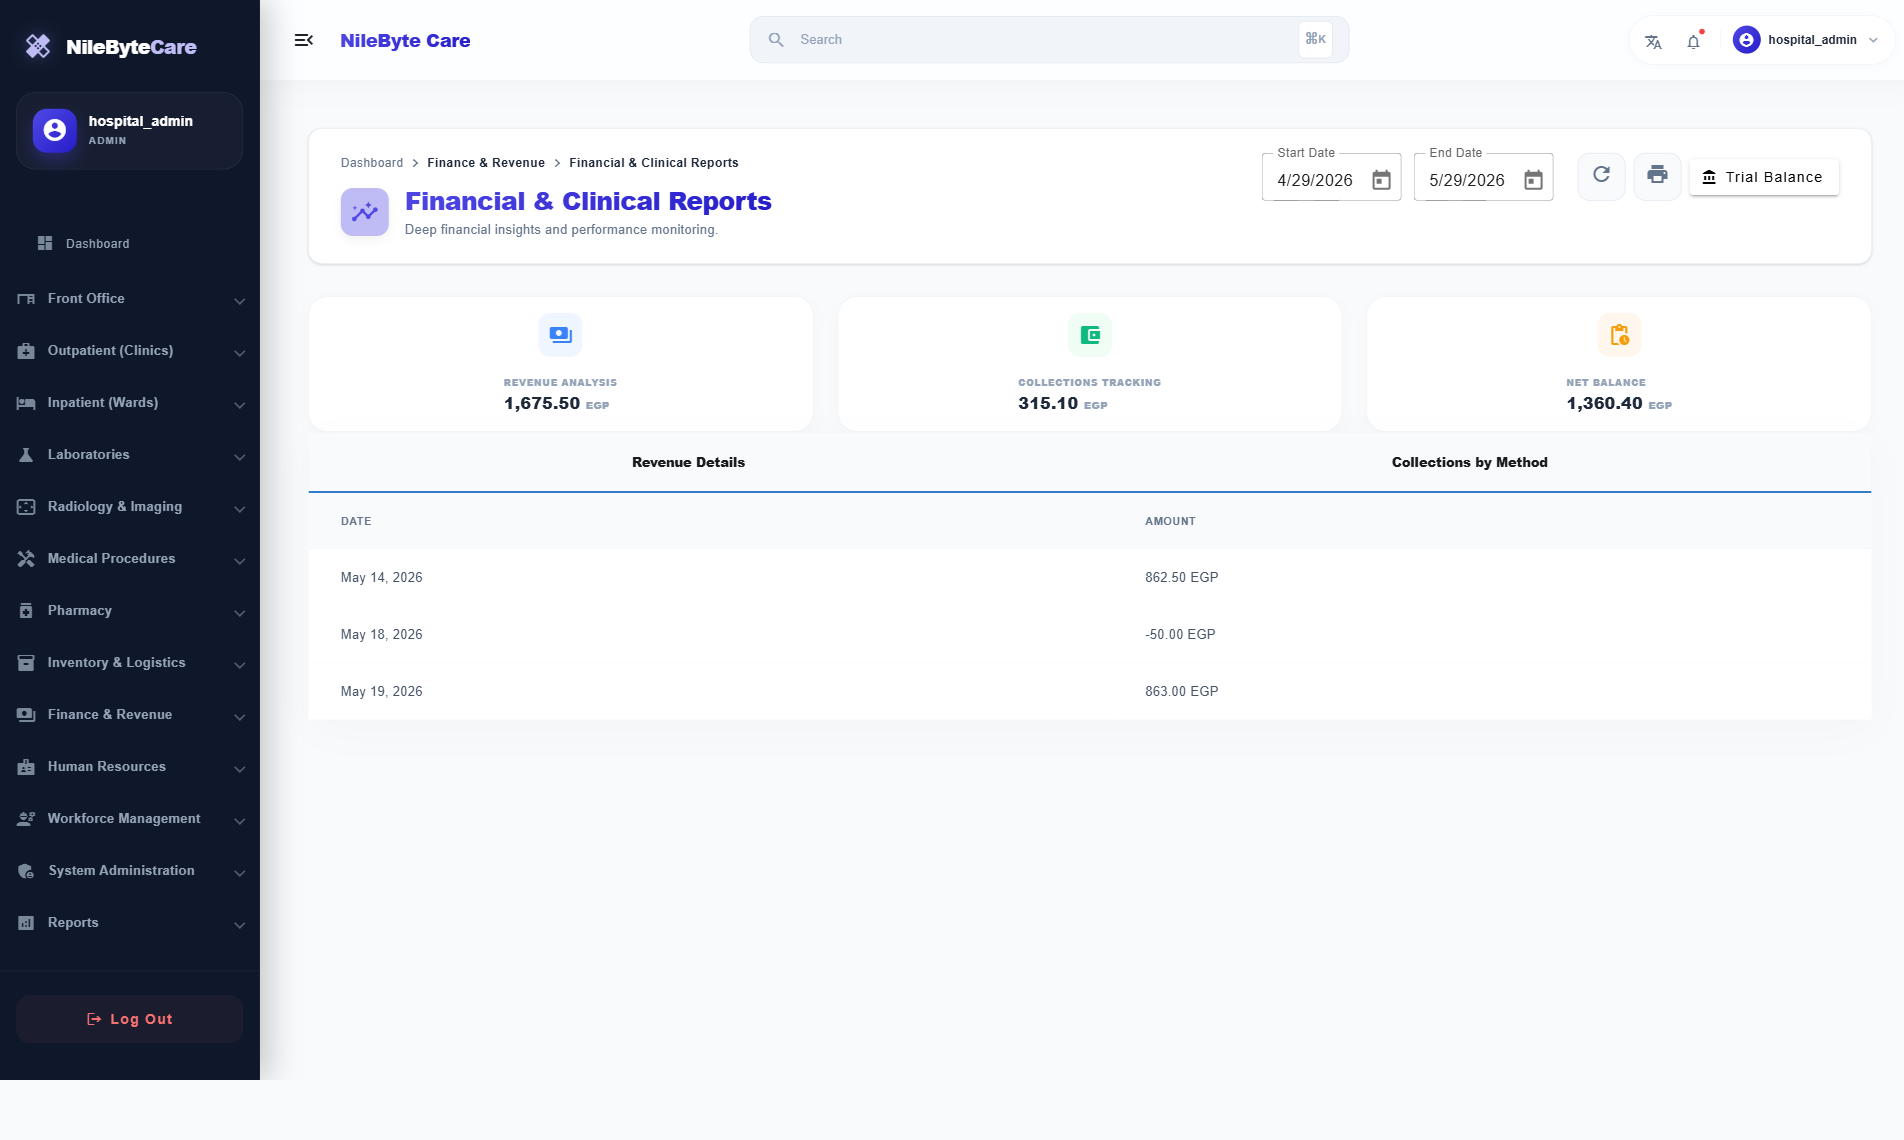
| Financial | Daily/monthly revenue, trial balance, income statement |
| Inventory | Stock levels, reorder status, batch expiry |
| Pharmacy | Dispensed medications, prescription trends |
| Appointment | Daily counts, show/no-show rates |
Data Visualization
NileByteCare uses Chart.js to create meaningful visualizations:
- Line Charts — Revenue/expense trends over time
- Bar Charts — Department performance comparison
- Pie Charts — Revenue by service type
- Gauges — Bed occupancy, attendance rate
- Tables — Detailed drill-down data
Export and Sharing
- Export reports to PDF and Excel
- Print-friendly report formats
- Scheduled email reports (coming soon)
- Dashboard sharing with stakeholders
Making Decisions with Data
Scenario 1: The executive dashboard shows bed occupancy at 95% and rising. Decision: Open a new ward or transfer stable patients to step-down units.
Scenario 2: The financial dashboard shows lab revenue declining while encounter volume is steady. Decision: Investigate whether lab orders are being captured correctly.
Scenario 3: The workforce dashboard shows a single practitioner carrying 40% of the patient load. Decision: Redistribute appointments or hire additional staff.
The NileByteCare Advantage
- Real-time data — No waiting for end-of-month reports
- Integrated view — Clinical, financial, and operational data in one place
- Drill-down capability — Click from summary to detail
- Role-based — Each role sees the KPIs that matter to them
Make data-driven decisions with NileByteCare’s powerful analytics suite.